Running and Monitoring Distributed ML with Ray and whylogs
Running and monitoring distributed ML systems can be challenging. The need to manage multiple servers, and the fact that those servers emit different logs, means that there can be a lot of overhead involved in scaling up a distributed ML system. Fortunately, Ray makes parallelizing Python processes easy, and the open source whylogs enables users to monitor ML models in production, even if those models are running in a distributed environment.
Ray is an exciting project that allows you to parallelize pretty much anything written in Python. One of the advantages of the whylogs architecture is that it operates on mergeable profiles that can be easily generated in distributed systems and collected into a single profile downstream for analysis, enabling monitoring for distributed systems. This post will review some options that Ray users have for integrating whylogs into their architectures as a monitoring solution.
LinkWorking locally with large datasets
At the beginning of a new project or Kaggle tournament, you often have to analyze datasets on a laptop, perhaps in the form of Pandas DataFrames. This exploratory phase can often be sped up greatly with parallelization. Ray makes it easy to do anything in Python in parallel so it's pretty easy to get whylogs profiling large datasets with a speed boost from parallelization.

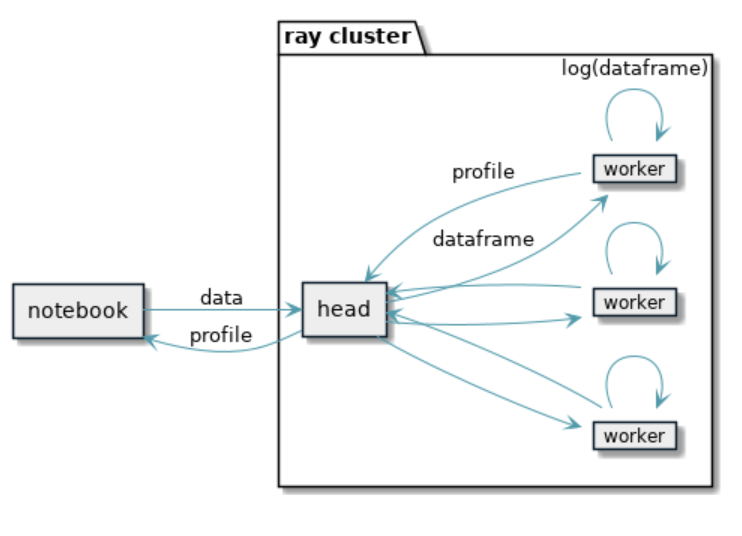
Imagine a notebook use case where you want to use whylogs to generate a profile of the entire dataset to glance at some high level statistics and distribution properties. Ray can be used to divide the dataset up and send different chunks to worker processes which would then use whylogs to generate profiles. The profiles can then be reduced into a single profile by merging all of the results.
First, we’ll set up the remote function log_frame for Ray to execute that will essentially convert Pandas DataFrames into whylogs profiles.
1from functools import reduce
2import pandas as pd
3import ray
4from whylogs.core.datasetprofile import DatasetProfile
5
6data_files = ["data/data1.csv", "data/data2.csv", "data/data3.csv"]
7
8@ray.remote
9def log_frame(df: pd.DataFrame) -> DatasetProfile:
10    profile = DatasetProfile("")
11    profile.track_dataframe(df)
12    return profile
13
14def main_pipeline_iter() -> DatasetProfile:
15    pipeline = ray.data.read_csv(data_files).window()
16    pipelines = pipeline.iter_batches(batch_size=1000, batch_format="pandas")
17    results = ray.get([log_frame.remote(batch) for batch in pipelines])
18    profile = reduce(
19        lambda acc, cur: acc.merge(cur),
20        results,
21        DatasetProfile(""))
22    return profile
23
24if __name__ == "__main__":
25    ray.init()
26    main_pipeline_iter()
The next part uses Ray pipelines to divide up the dataset and distribute the work across the available Ray nodes/processes. The iter_batches method is used to pick a batch size to divide the data. You can pick whatever number makes sense for the size of your dataset and the number of cores you’re using, just make sure you’re using the Pandas format if you’re using whylogs track_dataframe to log. At the end of this process, we’re left with a list of whylogs profiles that we have to merge back into a single profile, which can be done with a reduce. A merged profile will end up looking similar to this, containing various statistical summaries derived from the data.
That will leave you with a single profile that you can explore using any of our examples. Ray pipeline’s iter_batches were used in the example above but Ray does have a few other abstractions that could have been used instead. Using pipeline.split(n) could have worked as well. There are a few ways to accomplish similar results.
LinkProfiling data during inference with Ray Serve
Ray has an easy-to-use scalable model serving library called Ray Serve that lets you define a service in Python and then scale it out to a Ray cluster. Companies like Wildlife, cidaas, hutom, and Dendra Systems have already shown how it excels as a model serving framework, but it is also important to note that it can be used for other use cases as well. This section of the post goes over a Ray Serve example with a dedicated inference endpoint that sends data to a secondary dedicated logging endpoint.

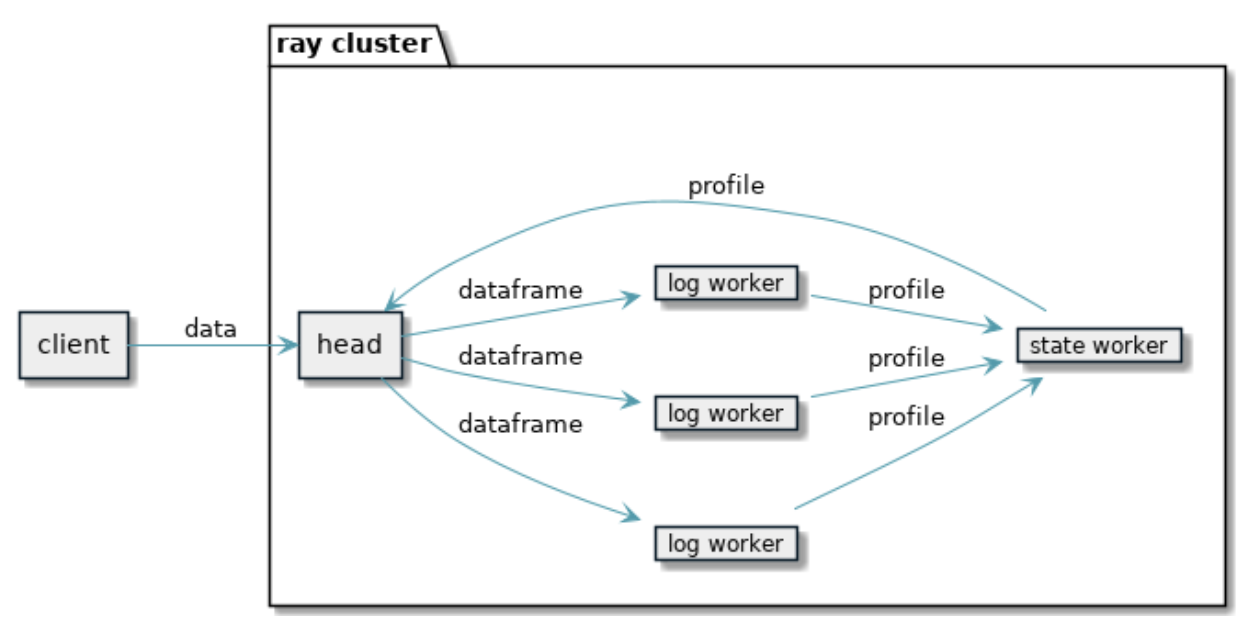
This is a scrappy setup for experiments or prototyping. It uses a Ray actor as a dedicated state accumulator. As data flows in, workers will be invoked with dataframes. They’ll convert the dataframes into whylogs profiles and send those over to the stateful actor to merge the profile into the existing profile. Concurrency issues are resolved with an asyncio queue that serializes the profile mergers. The current profile state is queryable through the Logger endpoint at any point in time.
The inference endpoint takes data in CSV form. We can send data to it with curl by running curl 'http://127.0.0.1:8000/MyModel' --data-binary @data.csv.
1import io
2import time
3
4import pandas as pd
5import ray
6from ray import serve
7from starlette.requests import Request
8from whylogs.core.datasetprofile import DatasetProfile
9
10ray.init()
11serve.start()
12
13@ray.remote
14class SingletonProfile:
15    def __init__(self) -> None:
16        self.profile = DatasetProfile("")
17
18    def add_profile(self, profile: DatasetProfile):
19        self.profile = self.profile.merge(profile)
20
21    def get_summary(self):
22        return str(self.profile.to_summary())
23
24singleton = SingletonProfile.remote()
25
26@serve.deployment()
27class Logger:
28    def log(self, df: pd.DataFrame):
29        profile = DatasetProfile("")
30        profile.track_dataframe(df)
31        ray.get(singleton.add_profile.remote(profile))
32
33    async def __call__(self, request: Request):
34        return ray.get(singleton.get_summary.remote())
35
36@serve.deployment
37class MyModel:
38    def __init__(self) -> None:
39        self.logger = Logger.get_handle(sync=True)
40
41    def predict(self, df: pd.DataFrame):
42        # implement with a real model
43        return []
44
45    async def __call__(self, request: Request):
46        bytes = await request.body()
47        csv_text = bytes.decode(encoding='UTF-8')
48        df = pd.read_csv(io.StringIO(csv_text))
49        # log the data with whylogs asynchronously
50        self.logger.log.remote(df)
51        return self.predict(df)
52
53Logger.deploy()
54MyModel.deploy()
55
56while True:
57    time.sleep(5)
The logging endpoint will log DataFrames asynchronously so inference isn’t delayed. This example keeps state in the controllers indefinitely.
This endpoint returns the summary that whylog’s profiles produce when called with curl ‘http://127.0.0.1:8000/Logger'. We’ll use the log method directly from the inference endpoint. This will look a lot like the local Ray example we covered previously. Since the Logger endpoint can be called concurrently to eventually merge data into its lone dataset profile, we’re making use of asyncio to serialize updates to the profile state so we don’t step on our own toes when multiple requests are being logged.
To analyze the profiles, you need to get them out of Ray and into an application that allows you to analyze whylogs profiles. One such application is the open source profile viewer included in the whylogs library.
LinkUsing the whylogs container during inference
This is the best way to integrate whylogs into a Ray cluster in a production environment at the moment. You won’t have to worry about maintaining state on the cluster and you won’t risk losing any state after crashes.

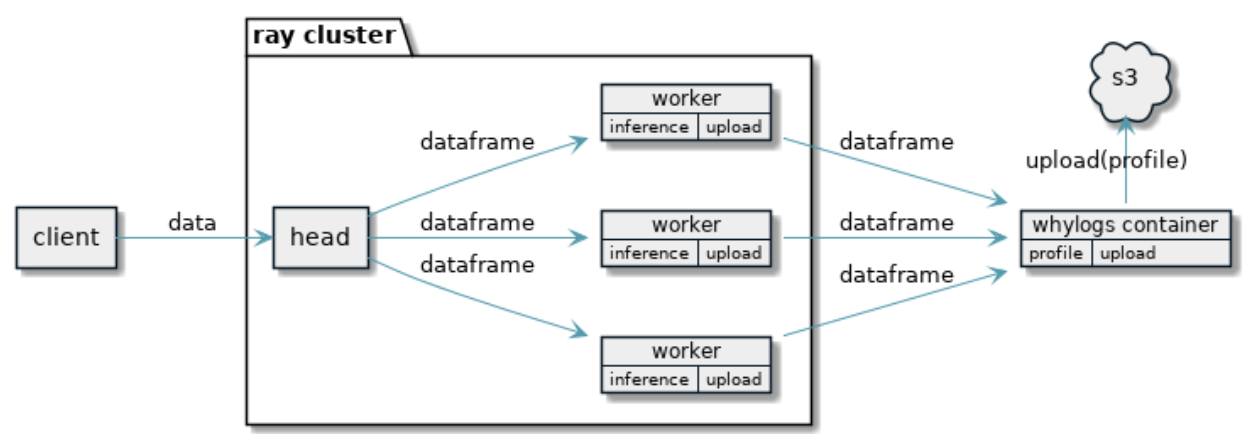
This integration option makes use of our whylogs container, which lives external to the Ray cluster. Instead of running whylogs in a dedicated endpoint within Ray, you have an endpoint dedicated to sending data in Pandas format to an external container that you host with your preferred container hosting solution. From there, the container can produce profiles for each hour/day (depending on your configuration) and upload them to s3.
1import json
2import requests
3import io
4import time
5
6import pandas as pd
7import ray
8from ray import serve
9from starlette.requests import Request
10
11ray.init()
12serve.start()
13
14@serve.deployment()
15class Logger:
16    def log(self, df: pd.DataFrame):
17        # Post request with data as the payload to your whylogs container
18        request = {
19            'datasetId': '123',
20            'tags': {},
21            'multiple': df.to_dict(orient='split')
22        }
23        requests.post(
24            'http://localhost:8080/logs',
25            json.dumps(request),
26            headers={'X-API-Key': 'password'})
27
28    async def __call__(self, request: Request):
29        return "NoOp"
30
31@serve.deployment
32class MyModel:
33    def __init__(self) -> None:
34        self.logger = Logger.get_handle(sync=True)
35
36    def predict(self, df: pd.DataFrame):
37        # implement with a real model
38        return []
39
40    async def __call__(self, request: Request):
41        bytes = await request.body()
42        csv_text = bytes.decode(encoding='UTF-8')
43        df = pd. read_csv(io.StringIO(csv_text))
44        # log the data with whylogs asynchronously
45        self.logger.log.remote(df)
46        return self.predict(df)
47
48Logger.deploy()
49MyModel.deploy()
50
51while True:
52    time.sleep(5)
Now, instead of logging, we can send the data frame in JSON format (using the split orientation) to the container. This allows you to find all of the data you logged in your s3 bucket split into separate profiles for each configured time period. The container rotates logs according to its configuration, so you’ll end up with a profile for every hour or day.
This example depends on a whylogs container running on localhost. Reach out on our slack for help configuring and running one.
LinkConclusion
Ray provides an easy-to-use interface for parallelizing your Python workloads, including ML models. whylogs allows you to generate logs of the data being sent to your ML model and the predictions that it makes, enabling observability and monitoring for the model in production. This means that you can easily and robustly run ML models in a distributed production environment using only open-source software to help you accomplish your goals.
For full examples from this post, as well as other integration examples, check out the whylogs github. If you have any questions about whylogs, how to integrate it with Ray, or how to use it to monitor your data and ML applications, join our Community Slack. If you’re interested in creating awesome tools for AI practitioners, check out our job postings on the WhyLabs About Page.