Analyzing memory management and performance in Dask-on-Ray
Ray is a general-purpose distributed system. One of Ray's goals is to seamlessly integrate data processing libraries (e.g., Dask, Spark) into distributed applications. As part of this goal, Ray provides a robust distributed memory manager. The goal of this blog is to compare the memory management and performance of Ray versus Dask with its built-in scheduler.
Dask-on-Ray is a community-contributed plugin now shipped with Ray that makes it possible to run any Dask task graph on a Ray cluster. This post focuses on the architectural differences between Dask and Dask-on-Ray and highlights some of the recent features that we’ve been working on in Ray: object spilling and better control of memory usage. These features enable Dask-on-Ray to scale sorting to 10x (or more) larger datasets than with Dask’s built-in scheduler.
We’ll compare Dask and Dask-on-Ray with microbenchmarks on two basic primitives: broadcasting a large object and sorting a large dataset. In particular, we’ll look at:
The impact of using Ray’s shared-memory object store vs. Dask’s in-process object store.
The consequences of choosing threads vs. processes as Dask workers.
System reliability under memory pressure, including stability of out-of-core processing.
These microbenchmarks show that it can be challenging to design and configure a distributed system to handle memory-intensive workloads. In this blog, we explain how we think Ray can make this simpler. We hope this will inspire greater use of Ray as a common backend for Dask and other distributed libraries, allowing the broader community to avoid having to build their own memory management.
LinkA quick disclaimer
Dask and Ray target different use cases, and hence they are not directly comparable in features. It will always be possible to find a workload that is faster on either Dask or Ray, and the microbenchmarks that we will show here cannot capture the full breadth of data processing workloads. Instead, our goal behind the microbenchmarks is to provide an apples-to-apples comparison of the same high-level operations running on different backends.
It is also worth noting that we are Ray developers and by no means are we Dask experts! We’ve tried to take due diligence for the sort benchmark and have filed tracking issues on the Dask GitHub here and here. You can also find the code and results for all of our benchmarks here.
LinkA primer on memory management in Dask and Dask-on-Ray
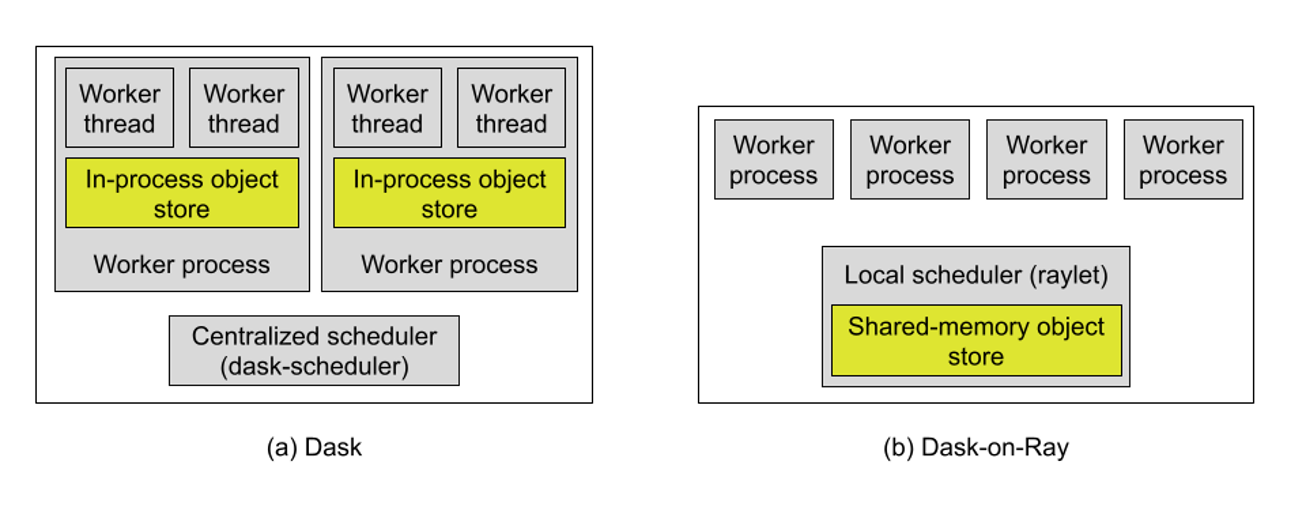 Single-node architectures for Dask and Dask-on-Ray. Each gray box indicates a distinct process. Dask uses an in-process object store, one per Dask worker process. Dask-on-Ray is a thin layer on top of Ray, which uses a single shared-memory object store per node.
A key design difference between Dask and Dask-on-Ray is the location of the object store. In Dask, the object store is in-process, meaning that there is one object store in the heap of each Dask worker process, and its contents are controlled by that worker. In Dask-on-Ray, there is one object store per node, implemented with shared memory and as a thread in the “raylet” process that handles resource management for that node. Both of these designs allow workers to directly access locally cached objects, but have significantly different characteristics in terms of memory footprint and performance.
Another difference is in how you can (or in some cases, are required to) configure each system’s memory management behavior. Both systems have a number of such parameters (such as specifying a local directory for spilled objects, which we’ll use in the sort benchmark), but here we highlight the most relevant ones.
For Dask, the knobs are:
Number of processes vs. threads. This is important because there is one object store per process, and worker threads in the same process can share an object store directly. On the other hand, using threads isn’t always ideal due to the global interpreter lock (GIL).
Memory limit per worker process. This is a soft limit.
Thresholds for handling memory pressure. You can set a number of thresholds, including when each worker should start spilling objects to disk and when to stop accepting tasks.
In Dask-on-Ray, the main parameter is how much memory the object store on each node may consume. This is a hard limit enforced by Ray.
LinkMicrobenchmark: Broadcasting a large object
First let’s look at the difference between an in-process object store (Dask) and a shared-memory object store (Dask-on-Ray).
An in-process object store incurs low cost for creating objects and reading objects from a different thread in the same worker process. This is because it can avoid:
Serialization/deserialization overhead, since objects are stored directly in Python.
IPC overhead, since objects stay in the local process heap.
However, sometimes a worker thread will need to read an object stored in a different worker process, to achieve parallelism in applications limited by the GIL. In these cases, an in-process object store can incur higher cost, even when the workers are on the same node. This is because of:
Serialization/deserialization overhead.
IPC overhead to copy or transfer the object.
Higher memory footprint when multiple processes need to read the same object, due to extra copies.
In contrast, a shared-memory object has a higher minimum cost to create or read an object:
Creation requires serializing the object, so that it can be stored in the raylet process.
Read requires deserializing the object (although this can be avoided depending on the object and serialization format).
Minimum of 1 IPC to read or create an object.
But there are also benefits from increased sharing, especially when multiple processes need the same object:
Lower memory footprint when multiple processes need to read the same object, since they can share the same memory copy.
Lower IPC overhead to read an object on the local node, since the object does not need to be copied.
We can see this pretty clearly in the following microbenchmark, which passes a 1GB numpy array to many parallel tasks (100 per node), each of which performs a sum. Each sum takes about 1s, and we have 32 vCPUs on each node, so the theoretical best is about 3-4s. Thus, most of the time shown here is system overhead from the respective object store designs.
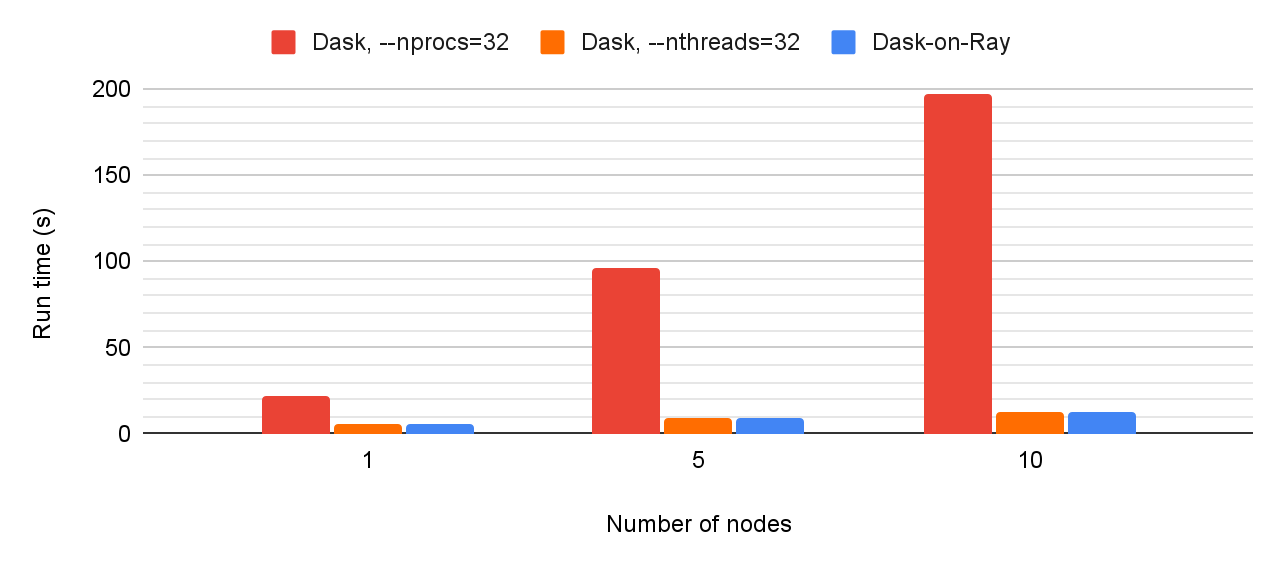 Measuring the time to pass a 1GB object to many tasks (100 tasks/node). Dask with multithreading and Dask-on-Ray can both take advantage of memory sharing to avoid copies, but Dask with multiprocessing requires copying the object. Dask-on-Ray also uses multiple processes but objects are stored in shared memory as opposed to local heap memory.
When broadcasting the same large object to many tasks, Dask-on-Ray and Dask’s object stores add about the same overhead, as long as threads are used for Dask workers. However, Dask’s in-process object store becomes a bottleneck if processes are used instead of threads. This is because most of the time is spent serializing/deserializing the object and copying it between worker processes. The bottleneck gets worse as more nodes are added because now the objects also have to be copied over the network.
So, why wouldn’t you just always use threads for Dask workers? Well, the problem with that is the Python global interpreter lock (GIL). The GIL is per-process and can only be held by one thread at a time, so any execution that requires the GIL will end up getting executed serially with other execution threads in the same process. While popular libraries like numpy are careful to not hold the GIL for extended periods, sometimes it’s unavoidable, especially if you need to write custom functionality.
Let’s look at that same benchmark, except this time we’ll also compare a version with tasks that hold the GIL. There are lots of possibilities here: in this case, each task randomly selects 10K items from the input array, which takes about 50–100ms with a single thread.
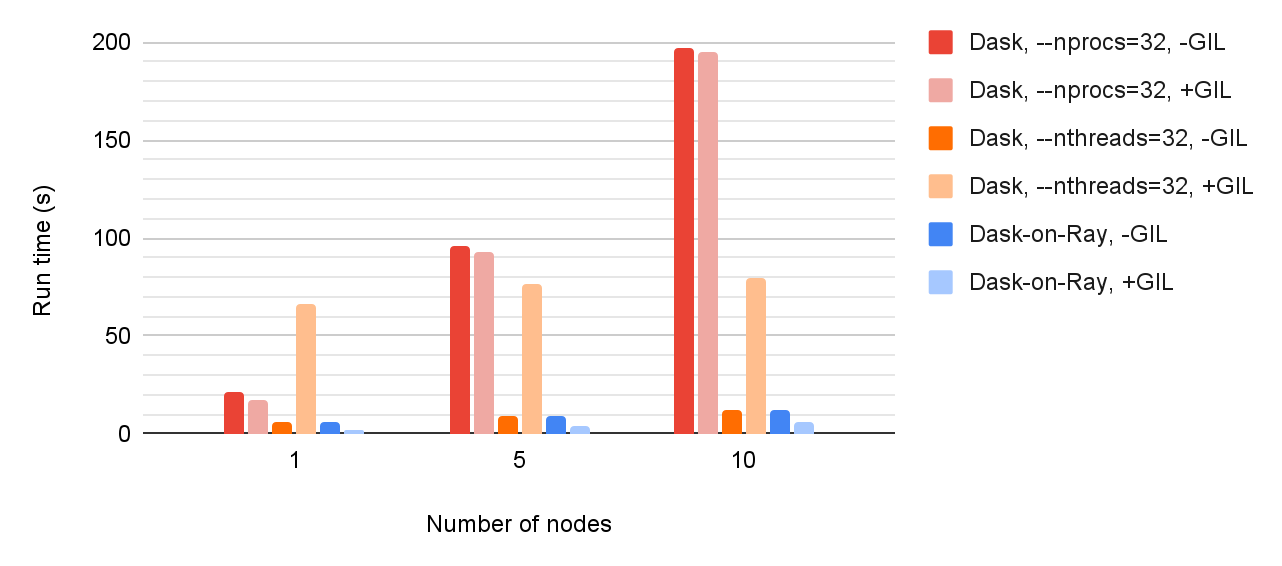 Measuring the time to pass a 1GB object to many tasks (100 tasks/node). Dask with multithreading can avoid unnecessary memory copies (dark orange), but performance suffers when the tasks require holding the GIL (light orange).
Now we can see the problem with always using threads in Dask. On a single node, using threads for tasks that hold the GIL (light orange) forces all computation to execute serially, so we end up with a much longer run time than with processes. Meanwhile, the difference between -/+ GIL for Dask worker processes (dark/light red) is about the same, since the work can still be done in parallel (+GIL is slightly faster because the tasks are shorter).
On the other hand, Dask-on-Ray (blue) always uses processes to parallelize work. There is some overhead in scaling out, likely due to data transfer, but overall the run time is about constant. This is true as we add more nodes, and whether or not the tasks hold the GIL.
In summary, we can compare these designs in the following way:
LinkMicrobenchmark: Shuffle (DataFrame.set_index)
Let’s take a look at another microbenchmark: sorting a dataset. This can be a challenging workload for the system because a sort requires shuffling the partitions of a dataset, which creates all-to-all dependencies. If the dataset is larger than memory, then the system must also have some method of spilling part of the working set to external storage, in this case the local disk. For these benchmarks, we’ll use the set_index method on a single-column Dask DataFrame with 100 partitions.
First, let’s look at performance when using processes vs. threads for Dask. We’ll first compare the systems on a 10GB DataFrame. Generally, the working set size for a sort should be about 2x the dataset size, so this should fit well within our 244GiB of RAM.
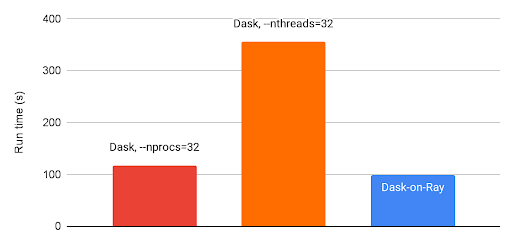 Dask.dataframe.set_index on a single node (32 vCPUs, 244 GiB RAM, 10GB dataset with 100 partitions). Dask sort performance depends on using processes instead of threads.
Here we can see again that using threads is not always ideal for performance, likely because the shuffle requires holding the GIL for significant periods. For the rest of these benchmarks, we’ll default to using processes in Dask to improve parallelism.
When we increase the dataset size to 20GB, we can start to see the effects of memory pressure. Depending on the partition size, the Dask set_index implementation may require objects to be spilled to complete this operation.
With 100 partitions (partition size 200MB), Dask fails to complete, exiting with a failed worker exception. This is likely because it reaches its memory limit before it can spill enough objects to make room (you can follow the GitHub issue here).
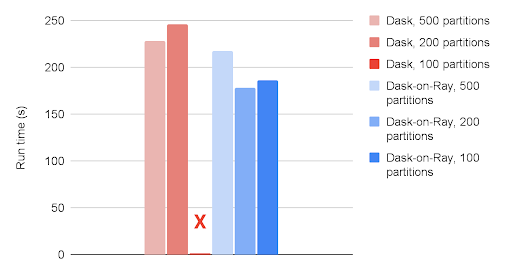 Dask.dataframe.set_index on a single node (32 vCPUs, 244 GiB RAM, 20GB dataset), while varying the number of partitions. Compared to Dask-on-Ray, Dask's stability is sensitive to the number of partitions.
We followed recommendations from the Dask community and increased the number of partitions. This should reduce the total amount of memory that each worker needs at a time. With 200 or 500 partitions, Dask was able to complete. Meanwhile, Dask-on-Ray succeeds and gets about the same performance with any number of partitions.
We also found that adjusting the number of worker processes helped with Dask’s ability to scale to larger datasets, while keeping the number of partitions (100) constant. This makes sense because it allows each worker to hold more objects in memory at the same time, at the cost of reduced parallelism. Using 8 processes instead of 32 allows Dask to finish on 20GB but not 100GB. Using 1 process allows Dask to finish on 100GB, but of course we see a similar slowdown as on 10GB.
In contrast, Dask-on-Ray transparently manages the number of workers for the Dask graph, so Dask-on-Ray is able to finish on all dataset sizes for a single node. On 100GB, Dask-on-Ray is ~9x faster than Dask with 1 process (the only configuration for Dask that succeeded).
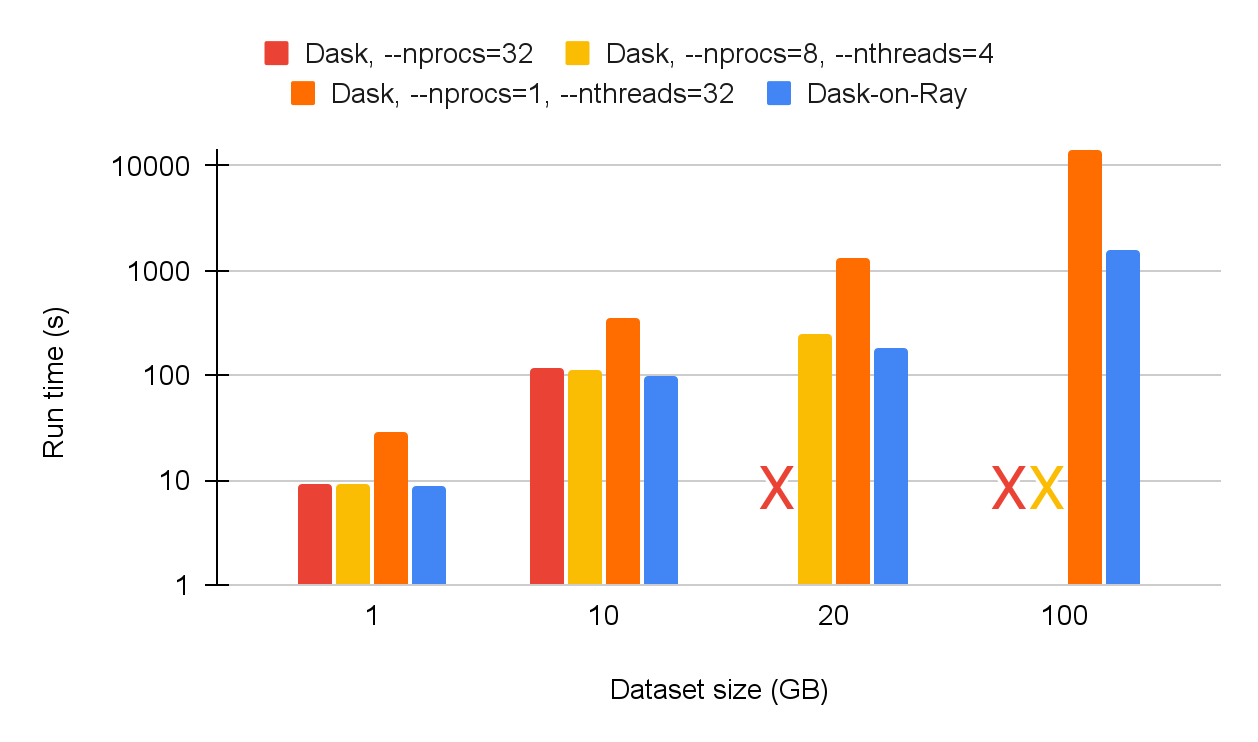 Dask.dataframe.set_index on a single node (32 vCPUs, 244 GiB RAM, 100 partitions), scaling the dataset size. Y-axis is log-scale. Decreasing the number of Dask workers from 32 to 8 allows Dask to complete on 20GB, but not on 100GB. Decreasing from 8 to 1 allows Dask to complete on 100GB, but with a 9x slowdown compared to Dask-on-Ray.
LinkAnalysis
As you can see, it can be quite tricky to find the right cluster and application configuration for sorting on Dask, at least on this Dask version (2021.4.0). While this is just one example of a memory-intensive application, we can already see the effects of the various parameters:
Processes vs. threads, and how many of each.
Number of data partitions.
Memory limit per process, which we increased proportionally in the previous benchmarks when decreasing the number of processes.
Memory thresholds for spilling, etc. Dask contributors recommended adjusting these to improve sort stability, but this did not seem to have an effect.
In an ideal scenario, these parameters should affect performance but not progress.
So why is Dask-on-Ray able to complete larger sorts when Dask can’t? It’s hard to say for sure, but here are a couple theories.
First, by using a single shared-memory object store per node, we can reduce the total memory footprint when Python processes are required for parallelism. Sorting produces all-to-all dependencies, which means that every worker will need to read at least one object produced by another worker. If the workers do not share memory, then each dependency will have to be copied to the receiver.
Second, by using a single shared-memory object store per node, it becomes easier to control the total amount of memory being used on the node. In Ray, there is a single thread that serves all object creation and read requests, so it can precisely control how much memory is used by objects at any given time. This allows us, for example, to limit the number of tasks that can run concurrently, based on the size of their arguments. These techniques are possible with Dask’s in-process object store, too, but because the objects are distributed among different workers on the same node, it would require coordinating memory usage across multiple processes.
Finally, a shared-memory object store provides a more precise measurement of the total memory usage on each node. Objects stored in the Ray object store are necessarily already serialized, so we know exactly how much memory they require. Although we can’t do the same for additional memory used by Python workers (e.g., for deserialization of arguments and/or temporary variables), this gives us a pretty good idea of each task’s memory requirements. In contrast, Dask objects are Python objects, so their memory usage is a best guess. The objects are also stored across multiple processes, so measuring (and controlling) the precise total memory usage on a node would require synchronizing the processes.
Together, these three characteristics allow Dask-on-Ray to impose a hard limit on the memory used by task inputs and outputs on a single node. It also makes object spilling relatively straightforward to implement: once an object store reaches capacity, new objects are blocked until existing objects are spilled. Similarly, required objects are restored according to queued tasks and available memory.
In summary, we find that:
It can be challenging to tune Dask configurations correctly when working with very large datasets.
Ray’s decision to use shared memory can sometimes add overhead to Dask-on-Ray, due to having to copy from the Python worker into a different process, but it can also add a lot of performance benefits from increased sharing.
Ray’s precise management of which objects to spill and restore is critical to the stability of memory-intensive Dask-on-Ray applications.
LinkUsing Dask-on-Ray for memory-intensive applications
Ray’s memory management is still under active development, so there are certainly memory-intensive applications where Ray can do better. Please file an issue if you find one; we’d love to learn more and help you!
In general, though, we believe that the design decisions that we highlighted here are fundamental and that Ray’s overall object store architecture is the right path towards efficient and reliable distributed memory management. There are already Dask-on-Ray users that are seeing the benefits of this approach. For example, one user with a petabyte-scale data processing job found that using Dask-on-Ray allowed her to save 3x in total compute cost and more than 10x in total run time.
If you’re interested in learning more, follow the Ray project on GitHub, join us on Discourse, and check out our whitepaper!
LinkAppendix: Benchmark setup
All of the benchmarks were run on i3.8xlarge machines on AWS EC2, which have 32 vCPUs, 244 GiB RAM, and 4x1.9TB NVMe SSDs. We used Python 3.8, Dask and Dask.distributed v2021.4.0, and Ray nightly wheels. All Dask-on-Ray benchmarks will be runnable with the upcoming Ray v1.5.
All input data for the sort benchmark is stored in Amazon S3 as gzipped Parquet files and read out using Dask’s built-in S3 reader for DataFrames. To optimize disk reads and writes for out-of-core processing in the shuffle microbenchmark, we mounted the 4 NVMe SSDs and pointed the Dask worker to one of these mount points. Ray has support for multiple directories when spilling to local disk, so we used this to improve read/write throughput for Dask-on-Ray.
For Dask workers, we used the default memory limits, unless stated otherwise.
For Ray, we used an object store limit of 50GB per node for the sort benchmark. It is possible and generally recommended to use more than this (up to the maximum size of /dev/shm, as specified to the OS), but we used a lower object store size as a workaround for a known bug in the shared-memory allocator. We are working on a complete fix for this bug in Ray v1.5.
Note that for Dask-on-Ray only, we use the shuffle parameters `shuffle='tasks'` and `max_branch=float('inf')` to force Dask to execute the shuffle as a task graph on Ray, instead of using Dask’s native shuffle. The results for Dask were not significantly different from the reported measurements when also using these parameters.
All benchmarking scripts and results can be found here.

