Introducing Anyscale GPU Health Observability: From app to hardware
A GPU that is quietly failing looks, from the outside, exactly like a training script that is quietly broken. That single ambiguity is responsible for more wasted engineering hours on GPU clusters than almost any other failure class, and it is the gap we are closing today.
Today we're announcing the private preview of Anyscale GPU Health Observability, the newest layer in Anyscale's full stack observability vision, compatible with KubeRay and VM’s with future support for K8s Anyscale Operator. It surfaces the GPU hardware signals engineers have always needed (XID errors, ECC memory error counts, SM Clock, and per GPU memory) and, critically, attaches them to the exact Ray job and workspace that are running on each GPU.
LinkWhy we need this level of observability
Ask any team running large scale jobs across clusters running on multi-GPU nodes how they found the root cause of their last hardware failure, and the answer is rarely as simple as a dashboard. It is usually a person, manually opening multiple different tools and stitching together a timeline by hand.
When a fatal XID error degrades the performance of a workload, Ray has no way to know that hardware was involved, so it reports a generic worker failure and sends the engineer straight into the training code, which doesn’t contain the actual problem. GPUs accumulating correctable memory errors give no warning before they take a worker down mid run, even though the error count had been climbing for hours in a metric few are paying attention to during a large-scale training job. NVLink interconnect degradation looks identical to ordinary network slowness until a multi GPU collective operation fails outright, and by then the job has already been running degraded for a prolonged period of time. Scale any of this across a cluster with dozens or hundreds of nodes, and a single struggling node simply disappears into a cluster wide average, indistinguishable from healthy neighbors unless someone happens to go looking node by node.
None of these signals are secret. DCGM has reported GPU health data for years, and Kubernetes has always emitted pod and scheduling events. The problem has never been a lack of data. It has been that the data lives in one place, the Ray job lives in another, and connecting the two has always required a person, or multiple people doing it manually, under pressure, after something has already gone wrong.
LinkCreating a single pane of glass at the source
The reason none of this has existed before is not a lack of effort. It is that correlating a hardware signal to the job it affected requires sitting at the intersection of the hardware layer and the distributed runtime running on top of it, and almost no platform owns both. Anyscale does, which means the correlation does not have to be reconstructed after the fact by a person copying node IDs between browser tabs. It can happen once, automatically, at the exact point where the signal originates. That single idea shows up in three concrete ways.
Industry standard signals, finally with context. DCGM is the industry standard for GPU health. We are enriching those metrics with the context that turns a raw counter into something an engineer can act on in the moment. GPU Health Observability takes DCGM metrics and enriches each metric with workload aware metadata. A metric like "GPU memory used: 38GB" is meaningless on its own. Attached to the right job, node, and GPU model, it becomes an actionable alert instead of a data point nobody has time to interpret.
One correlated view, not five disconnected surfaces. This is where the value compounds. Once a hardware signal knows which job it belongs to, the same correlation extends outward to everything else that used to require manual detective work. Per node failure attribution replaces cluster aggregate metrics with task failures, memory RSS, and OOM kill events broken out by node and instance type side by side with your hardware telemetry. None of this requires owning five different dashboards, because none of it requires reconciling anything after the fact. Anyscale owns both the hardware layer and the distributed runtime running on top of it, so the correlation happens automatically, at the source, as a single pane of glass rather than a set of tools someone has to stitch together by hand.
Works the way you are actually deployed. View active GPU health across your entire fleet of workloads, grouped by the node, workload, or K8s cluster for quick analysis. Easily dial in on the failing GPU that is causing the entire workload to crash, or catch a single bit issue before it actually happens all within the context of your underlying workloads.
LinkHow does it work?
GPU Health Observability is built on DCGM, the industry-standard GPU metric exporter. For most customers running on GPU’s, the dcgm-exporter comes natively with the GPU Operator. In a KubeRay environment simply adding the dcgmNamespace into the connector.yaml will allow the Anyscale Connector to start scraping the dcgm endpoint. For VM’s this happens natively today. Once forwarding, Anyscale’s collects this telemetry and enriches each one with the critical metadata before surfacing it in the console.
The result shows up in two places, depending on who you are and what you're trying to do.
LinkFleet-level view: for platform operators
Open the GPU Status tab in the Anyscale console and you get a fleet-wide picture of every GPU across your entire cloud, grouped by node type, K8s cluster, or workload. A team running hundreds of GPUs across multiple clusters can see at a glance which nodes are healthy, which are degraded, and which have active hardware faults
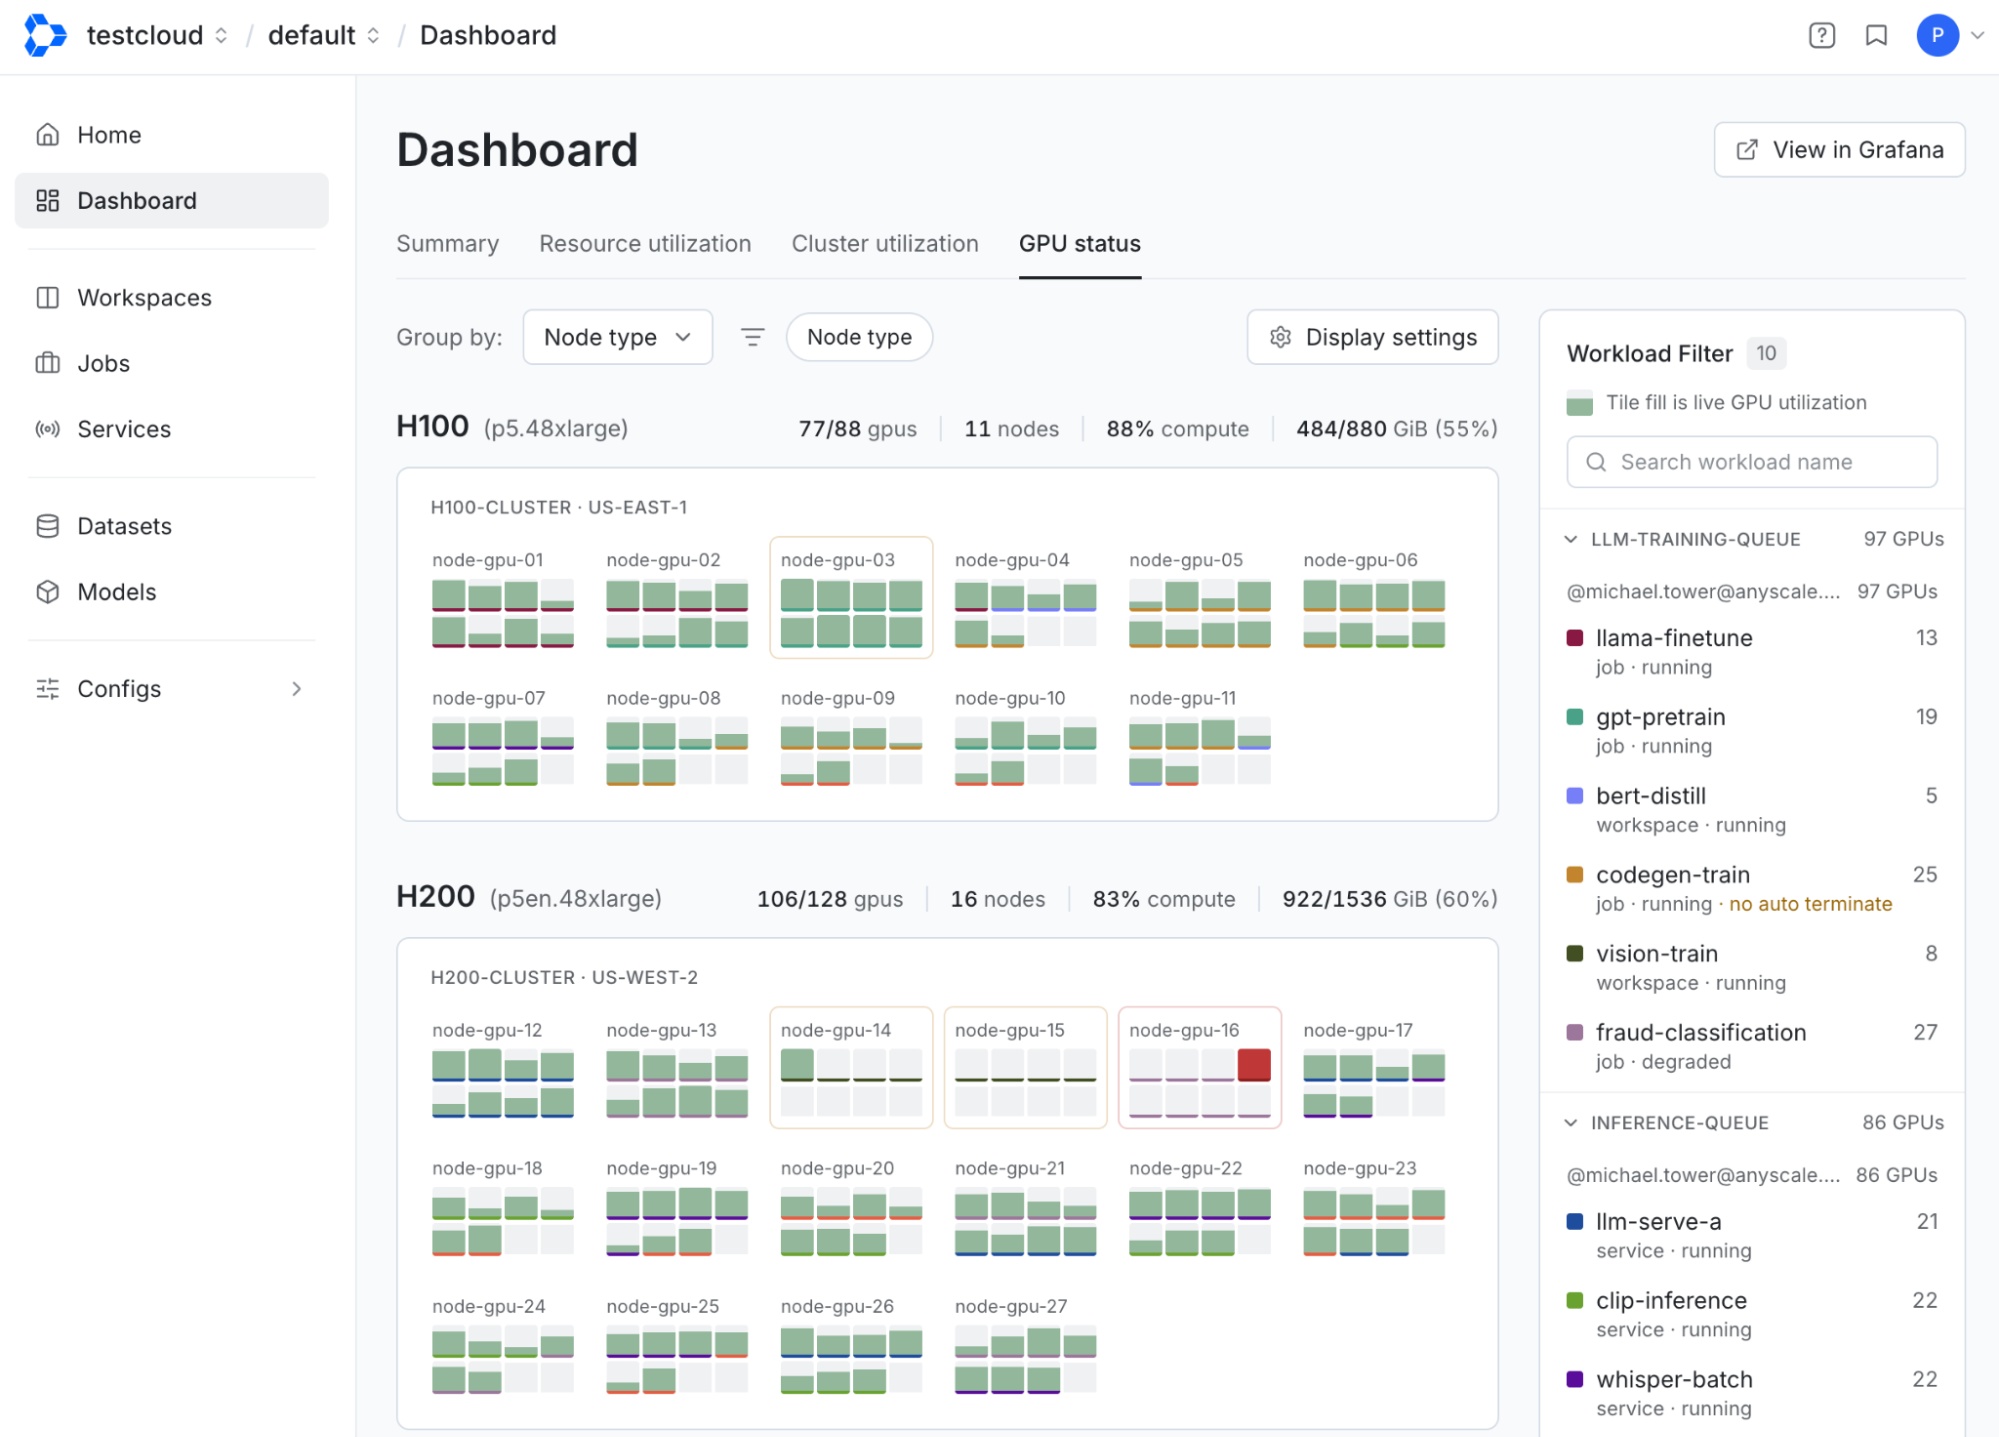 Screenshot: Fleet-level view grouped by node type. Nodes display GPU mini-bars with color coding — green for healthy, red for hardware error. The affected node stands out immediately among healthy neighbors.
Selecting a node opens a detail panel sidebar with two tabs: Overview and GPUs. The Overview shows CPU, memory, and GPU utilization alongside the workloads currently running on that node. The GPUs tab breaks out every GPU individually including, compute, memory, power, temperature, with error badges on any GPU that has an active fault so that you can easily identify which piece of hardware you need to take action on.
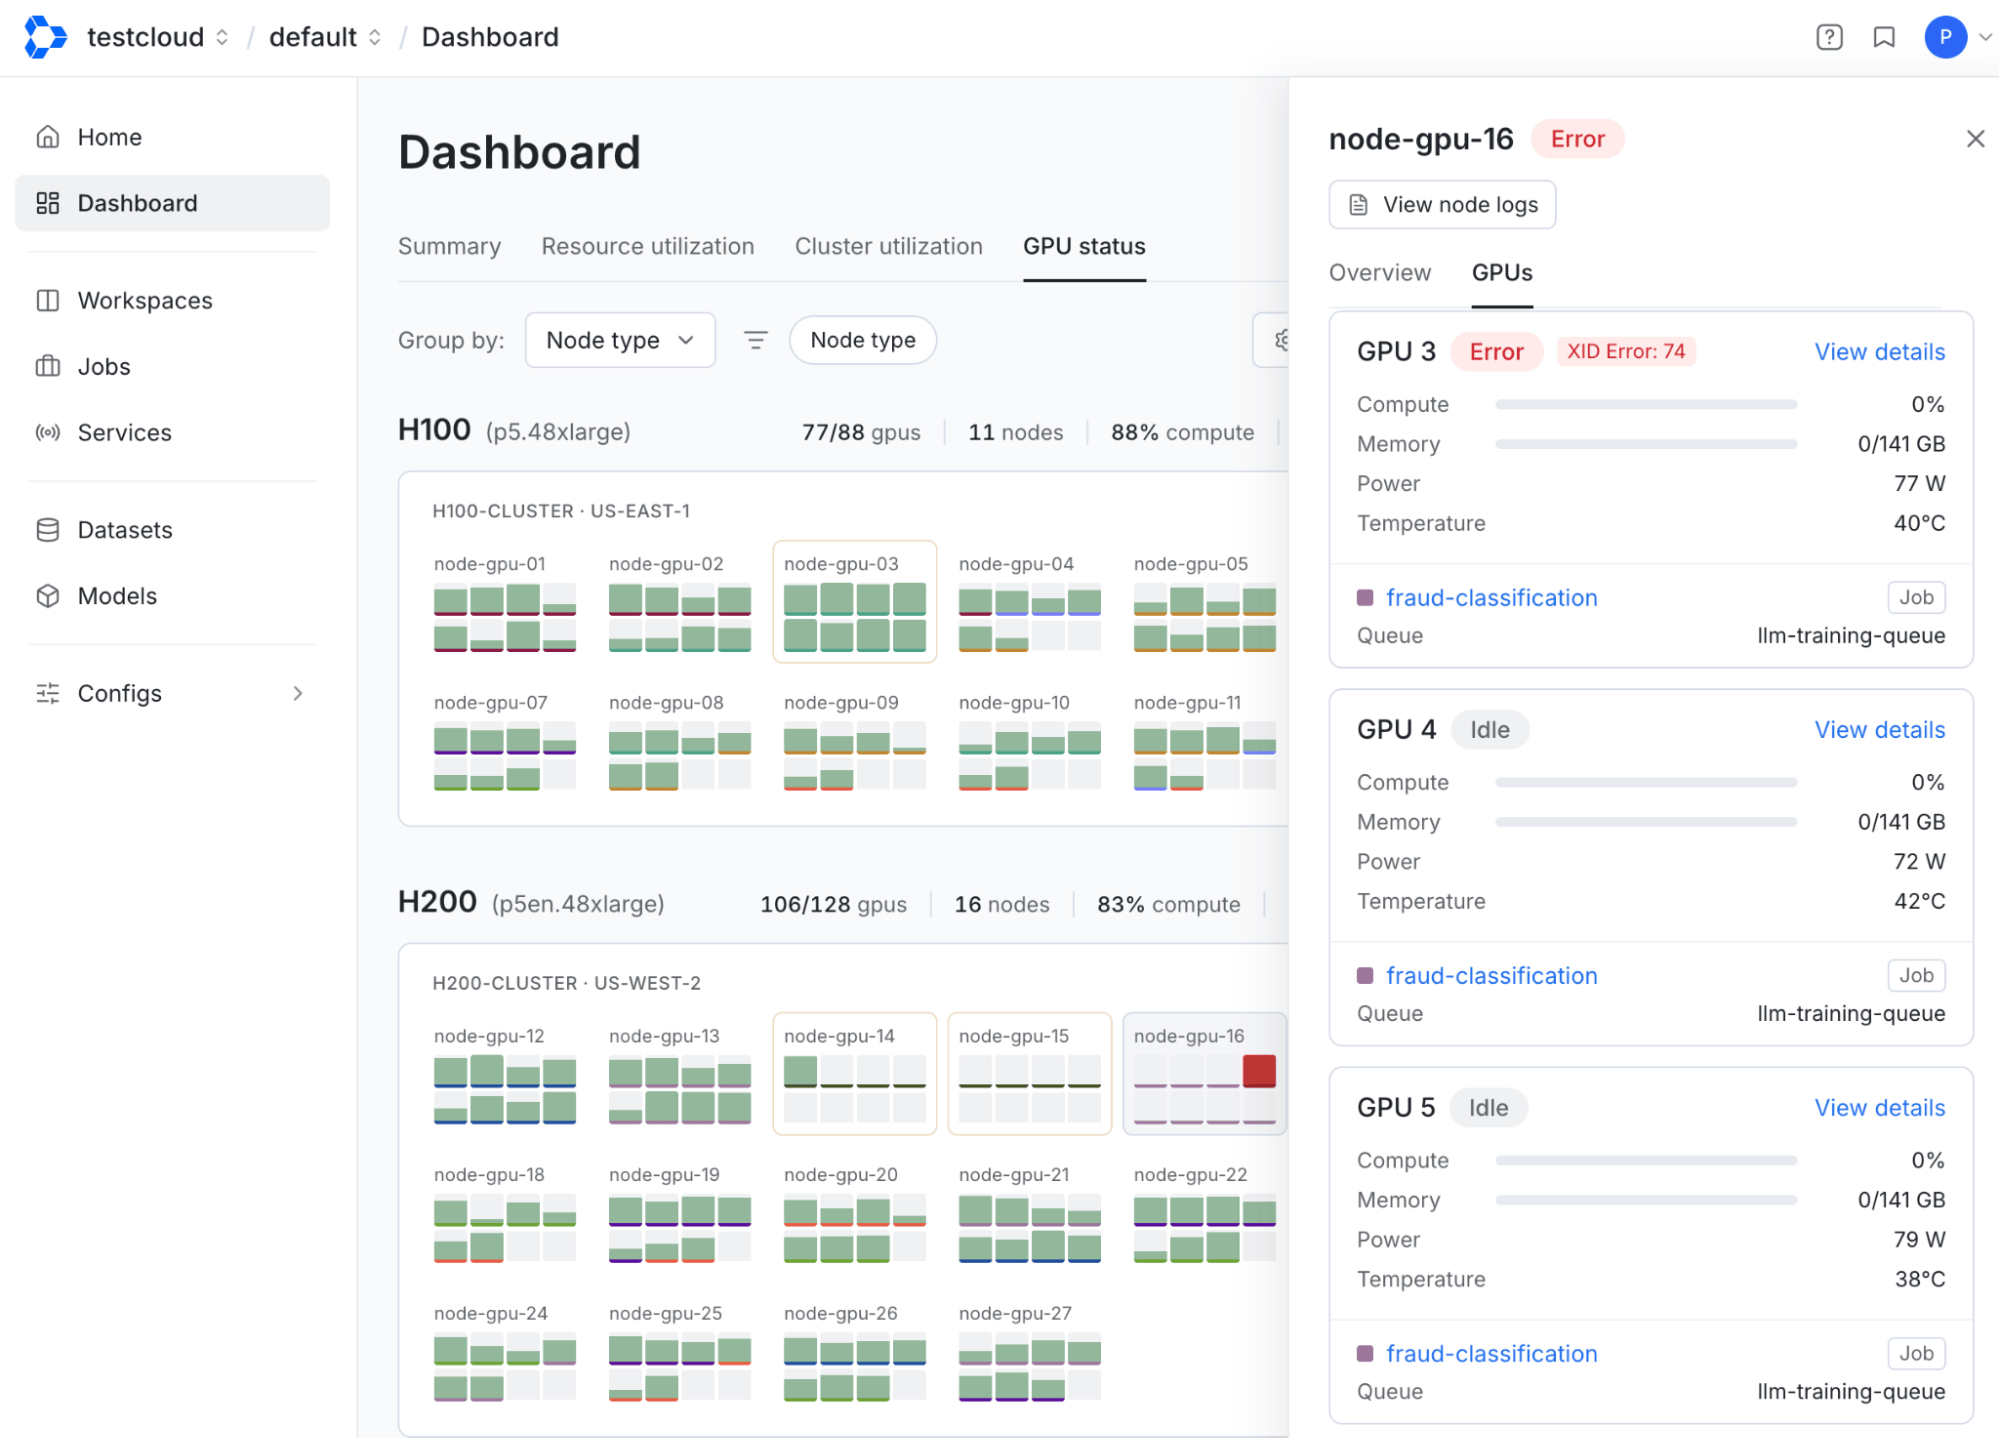 Screenshot: Node detail panel with the GPUs tab selected, showing 8 GPU cards. GPU 3 displays a red "XID Error: 74" badge while the remaining GPUs show normal metrics.
From here, clicking into the affected GPU shows per-GPU detail: the specific XID code, NVLink replay count, ECC errors, SM Clock, power draw and which workloads were running on that GPU when the fault occurred. The same view that tells you something failed also tells you whether the rest of the node is healthy enough to keep using.
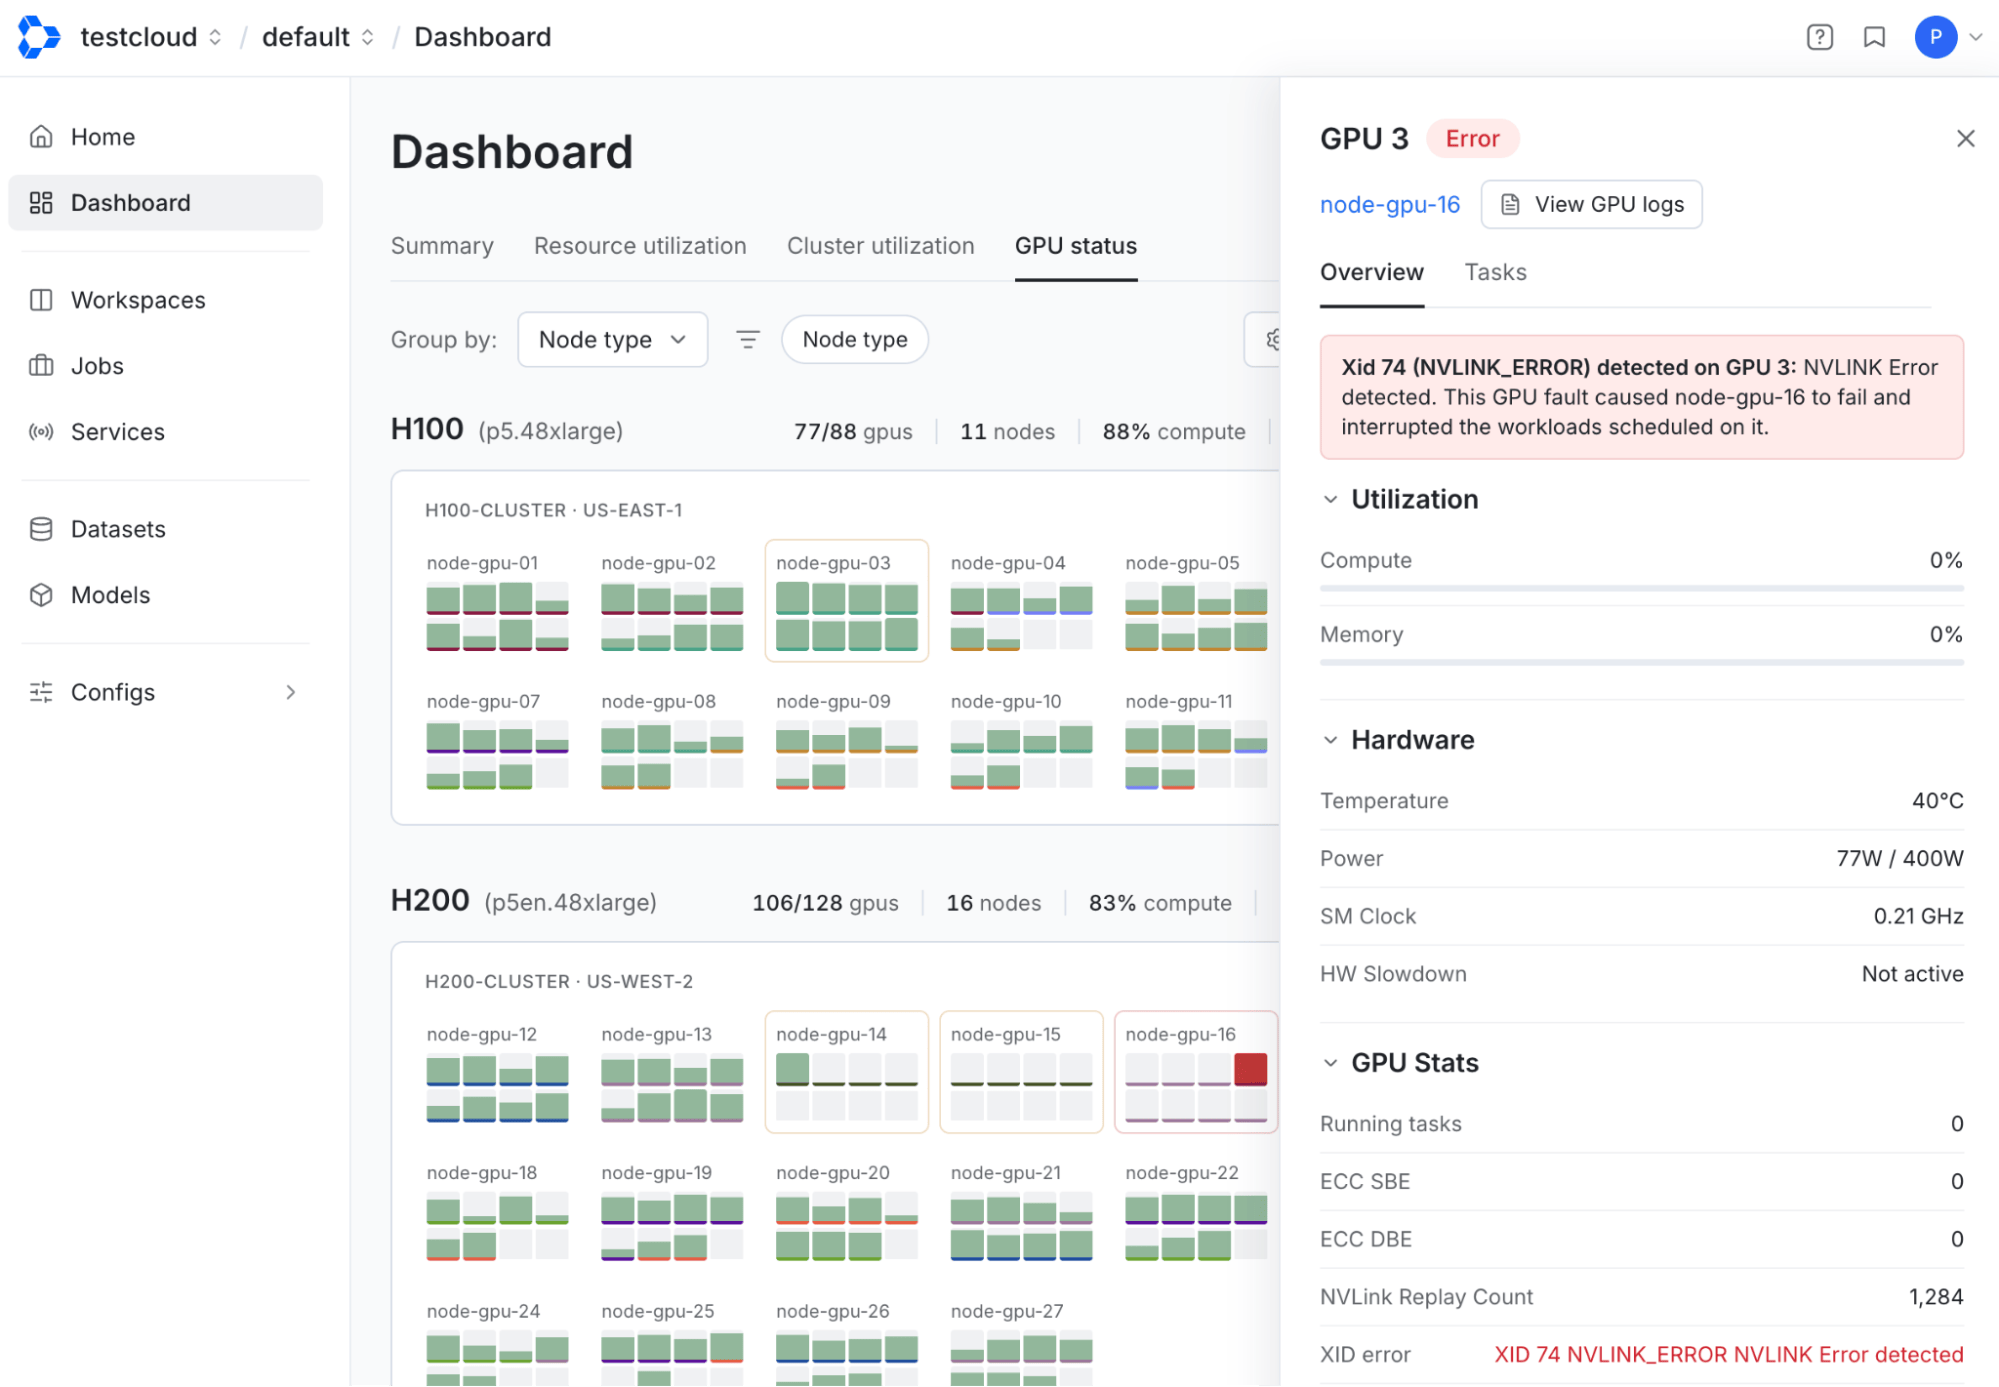 Screenshot: Individual GPU Detail tab showing the GPU / Accelerator metric list. Easily identify GPU health status, utilization, and error codes from XID.
LinkJob-level view: for ML engineers
An ML engineer debugging a failed training job starts in a different place, the Jobs console, but arrives at the same answer. When DCGM detects a GPU fault on any node associated with a job, a hardware error banner appears at the top of the Job Overview page, naming the exact node, GPU, and XID error. One click navigates directly to the GPU detail.
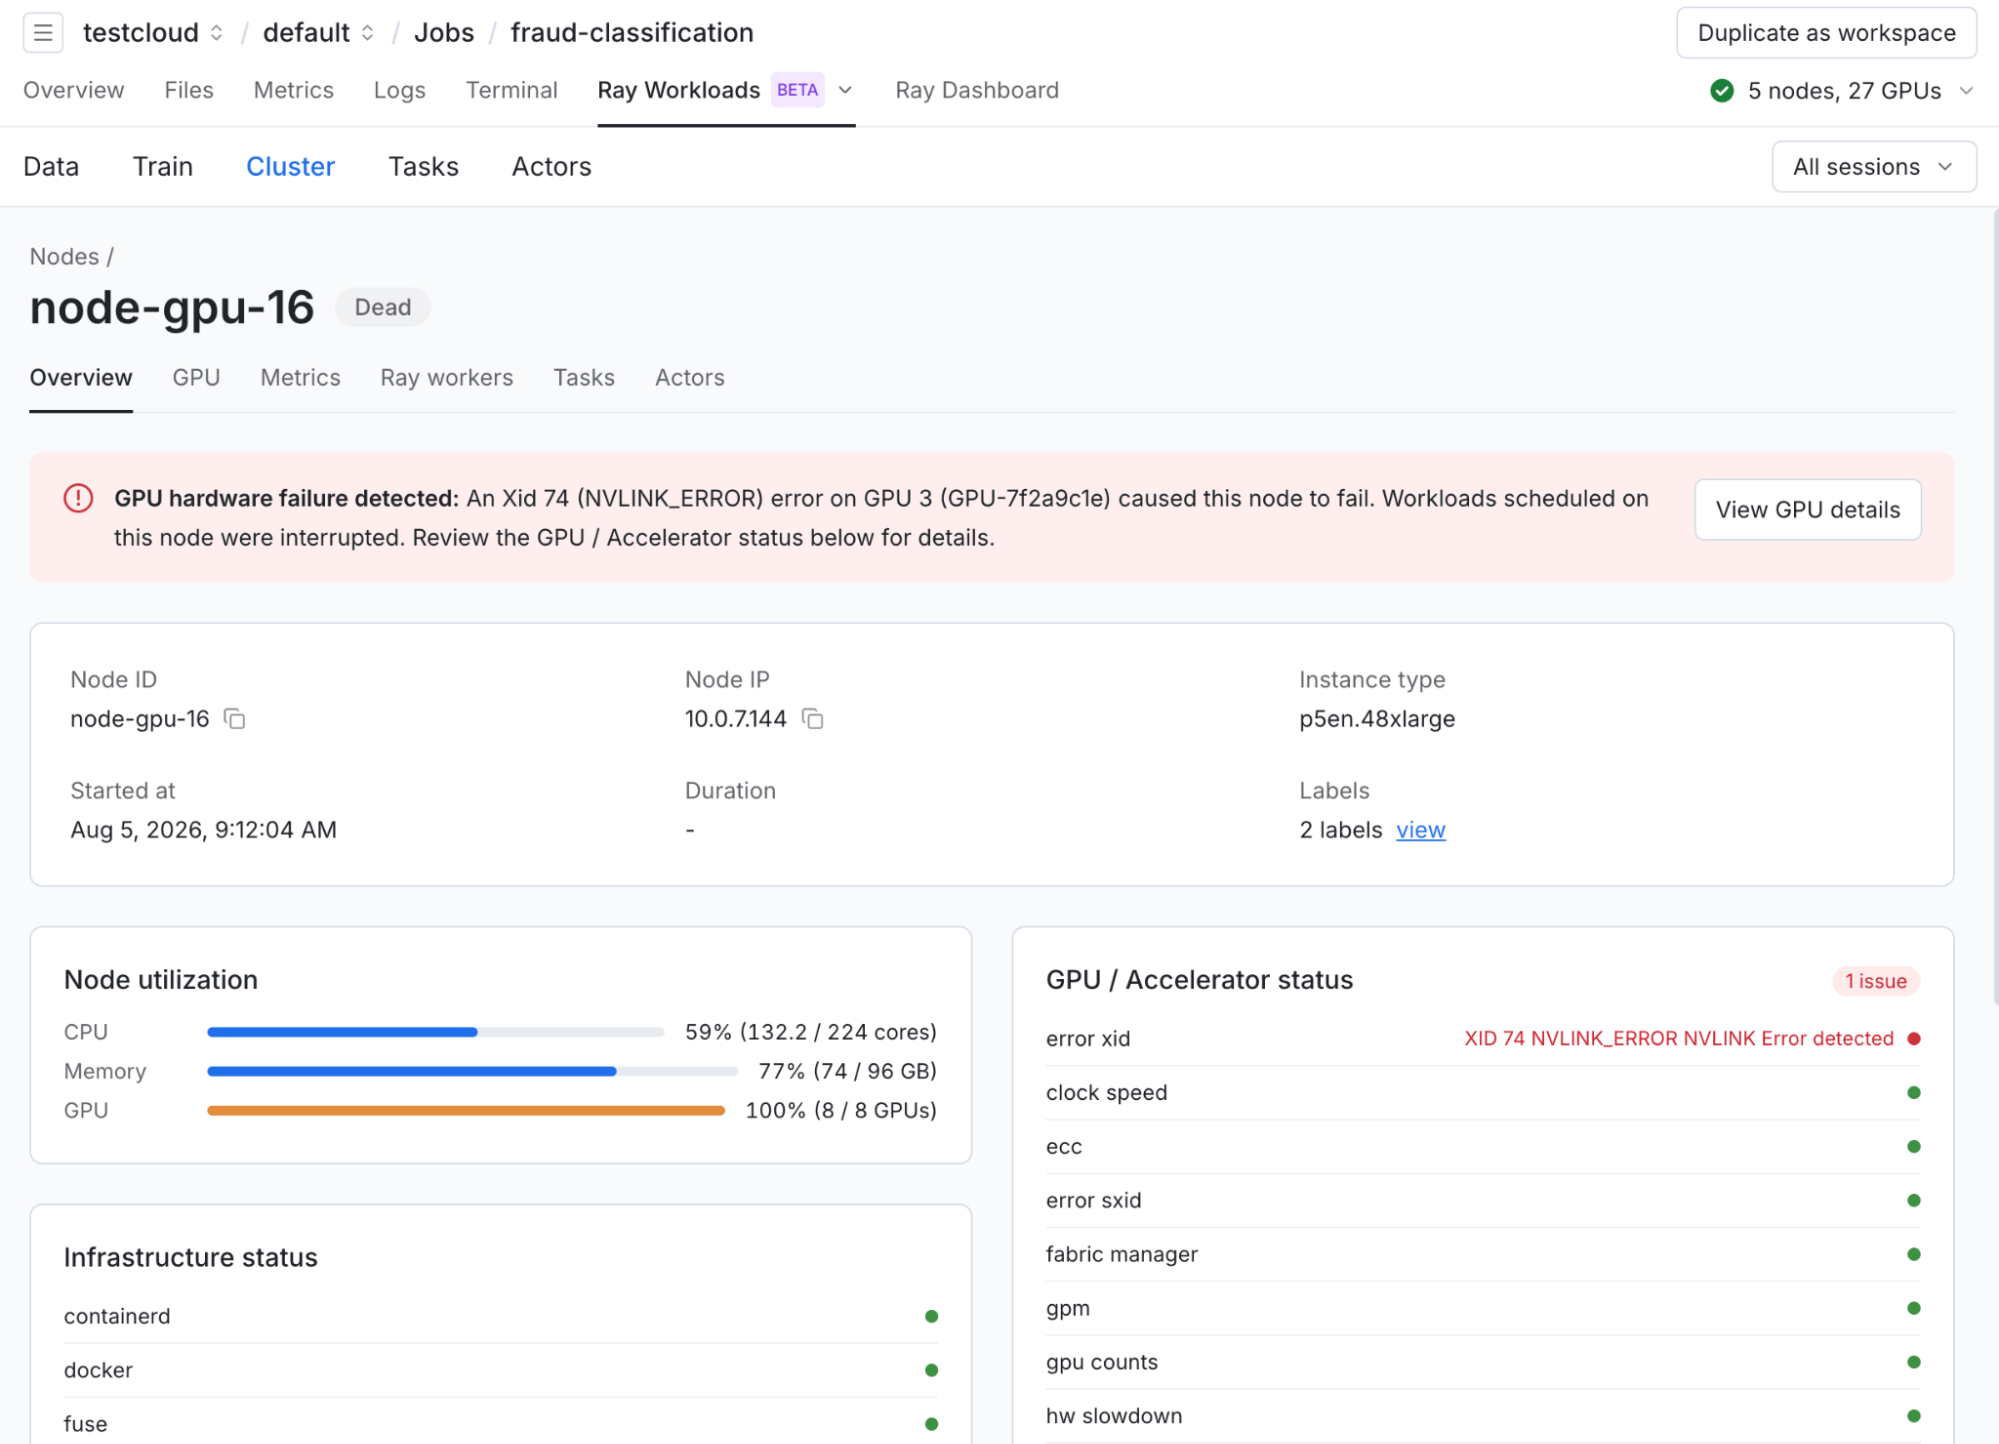 Screenshot: Job Overview page showing the red GPU hardware error banner: "An Xid 74 (NVLINK_ERROR) error was reported on GPU 3 on node node-gpu-16. This hardware fault may cause this job to fail." with a "View GPU details" link.
Inside Ray Workloads, the Train view shows which workers were affected including their world rank, node, GPU assignment, and status. The engineer can see that workers on the faulted node died while workers on healthy nodes completed normally. Combined with the hardware error banner, the root cause is clear: this was a GPU hardware fault, not a training script bug, not a NCCL misconfiguration, and not an OOM.
The distinction matters because without this correlation, a failed job produces a generic "worker died" message and the engineer starts debugging in the wrong place entirely. GPU Health Observability closes that gap by connecting the hardware signal to the job at the source, automatically, before the engineer ever opens a terminal.
LinkBeyond jobs and workspaces: the same lens for inference
The principle behind GPU Health Observability, which is to correlate signals across layers in a single view applies equally to inference workloads. For Serve users, we recently shipped a cluster topology view that maps every deployment, actor, and node into one interactive surface. Engineers can move top-down through their cluster topology, click into any service to see its overview, metrics, logs, and status, and triage production issues without switching between tools. It's the same reduction in mean time to resolution, applied to the workload type where uptime matters most.
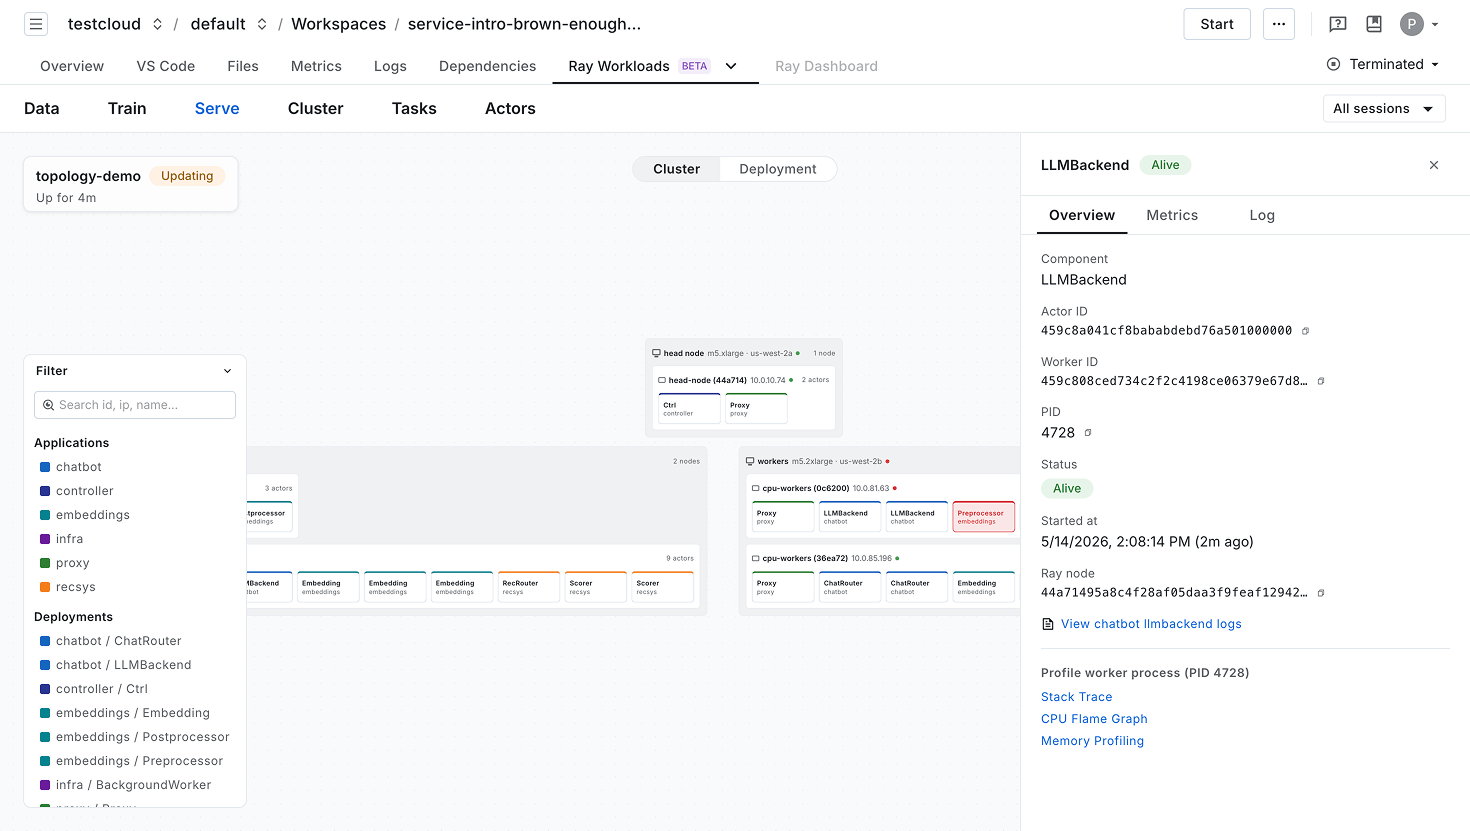
LinkWhat's Coming Next
GPU Health Observability is the first piece of a broader signal layer we are building out across the rest of this year. We are going to continue our push to become the best observability tool for GPU’s in context to your ML workloads offering deeper analysis, granular health signals, and fault tolerance to help users keep their jobs running even if the underlying hardware is at fault.
Kubernetes coverage is expanding too, starting with K8s - Anyscale Operator managed environments in conjunction with our Foundations team.
Anyscale Observability is actively evolving alongside the Ray ecosystem and the broader AI infrastructure landscape, and GPU Health Observability is the clearest sign yet of where that is headed.